
Final Project!!!!
By:
Alex Moore
![]()
Its been a long and difficult road, but we are
here. The Final project! For the first part of our project we
journey on one more exploration.
Have you ever considered the function x3+y3 = a,
for some real number a? Of course
we have. What’s the fun exploring
this little guppy? Lets
investigate a function that is much more interesting!
Consider the function x3+y3
= 3xy. To get a feel for the
function let us graph it in the x,y-plane.
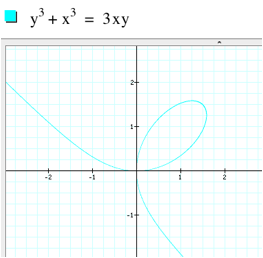
Not the nicest looking function,
but there is one great quality it has: this graph contains the origin! Why is this good? This opens up a way for us to
parametrize this curve. Recall
that parametrized curves are curves whose points are defined by (x(t), y(t))
where x(t) and y(t) are continuous functions. In order to parametrize any curve we need some variable to
measure. In this case, we can let
our parameter t be the slope of the line passing through the origin, y =
tx. For each value of the line y =
tx intersects the line at exactly 1 point (excluding the origin), call point
(x(t), y(t)).
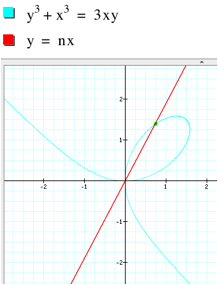
The green point represents
(x(n), y(n)) for t = n. Since we
are using y = tx, we substitute and solve for x(t):
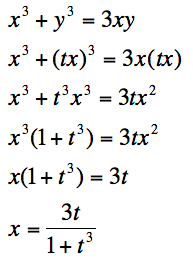
Not that when we divided both
sides by x2 in the 5th line we can do so with no fear
since x=0 implies t=0, so we have the x=0 case covered and so for the purposes
for above we have x is nonzero.
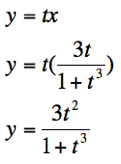
Now that we have x(t) we substitute into our original equation to solve
for y(t):
A minor detail here (that
really isn’t so minor) is that our parametric equation has a singularity. Since (-1)3 = -1, our
denominator is equal to 0 at t = -1.
Since t corresponds to slope, let us graph y = (-1)x.
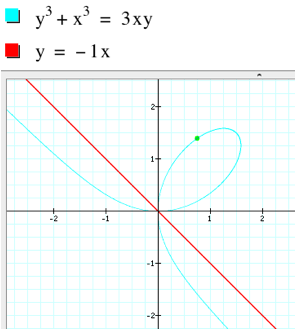
This portion of the graph
hints at why we have problems at t = -1.
It appears that the line y = -x intersects the graph only at the
origin. What will happen when t=
-1 when we graph our parametric equations? Let us see. The
graph on the left has t ranging from -0.9 to 20 and the graph on the right has
t ranging from -15 to -1.1.
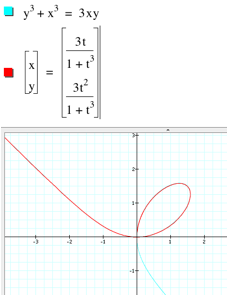
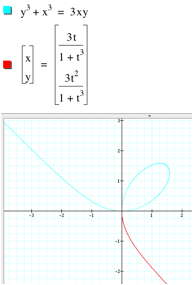
As we can see we get the
whole graph between the two values of t.
Let us now attempt to include t=-1.
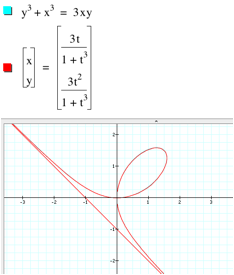
Where did this extra red line
come from?!? This is the program’s
attempt to add in the asymptote to the “tails” of the function. Why did it do that? Let us remind ourselves that we
understand the concept of limits of a function, and lets compute the limits of
x(t) and y(t) and t approaches -1.
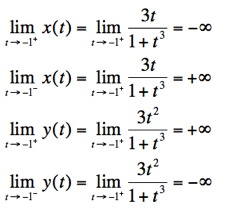
Clearly this limit does not
exist. As we approach -1 from the
right, (x, y) limit to (-inf, +inf) and as we approach -1 from the left we
approach (+inf, -inf). This red
line in our graph is not only an attempt to show as an asymptote but it is also
the program trying to connect the limits at infinity. As we know from assignment 10, parametrizations are not unique. Does there exists a parametrization for
this function without a singularity anywhere? The fact that the graph is self-intersecting certainly
lowers our hopes but perhaps there is!
Let
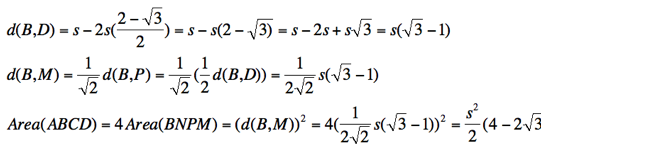
us move on to the next part of the final project! We wish to find the area of the shaded region
below.
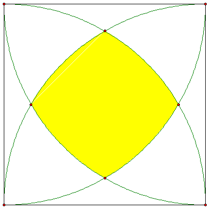
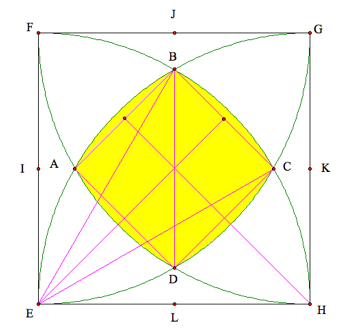
This region is a square with
a quarter circle arc from each corner producing a region bordered by four
smaller arcs. First we fiddle
around a little to help set up a strategy. It appears as though this region is the union of a square
and four partial arc sectors, as depicted below.
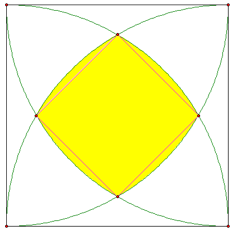
Clearly the 4 smaller regions
are portions of sectors and the area of those pieces is easily calculated. We focus for the time being on the
larger portion of the region. Label
the 4 points of intersection A, B, C, D.
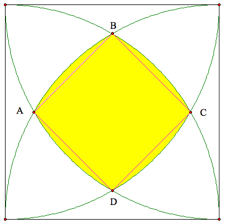
Now we use a little bit of
our trigonometry knowledge. We
know the point B has horizontal distance (½)s and the distance from the
bottom left vertex to B is s by construction. Therefore, by the Pythagorean Theorem we can calculate the
vertical distance from B to the bottom side.
Therefore, the distance from
B to the top side is the same as the distance from D to the bottom side is
Hence, the distance from B to
D is
Consider the new picture,
EFGH the large square with midpoints I, J, K, L.
By definition of cosine,
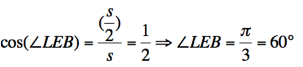
and by the symmetry of the
problem we conclude angle LEC has measure 30 degrees. That means that B and C subtend the arc from F to H into
three equal parts and therefore angle LEF is trisected. Hence, the perpendicular bisector of BC
is the angle bisector of angle LED!
By symmetry we also know that perpendicular bisector of AB is the angle
bisector of angle LHG!
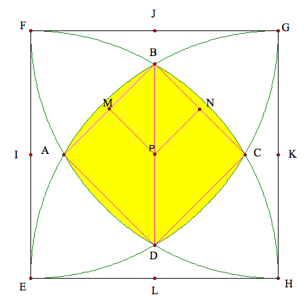
Therefore, since we have
right angles at angle BNP and BMP, we conclude that BNPM is a square! By the symmetry of the problem can
conclude that the area of BMPN is one-fourth the area of ABCD. Since d(P,B) = ½ d(B,D), we
have:
Now we find the area of each
of the sector portions.
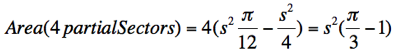
Since angle CEB has measure
30 degrees, which is pi/6 radians, the area of the sector CEB is (½)s2(pi/6) = s2(pi/12). The area of triangle EBC is
(½)(s)(s*sin(pi/6))=(1/4)s2 and so the area of the four
partial sectors and the total shaded area is:
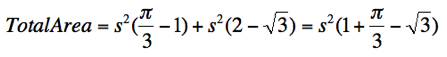
Therefore, the answer to our
problem is that the shaded region has area equal to ![]() where s is side length of the given
square!
where s is side length of the given
square!